
The NHS dentist shortage is worst in Somerset, where 22.7% of adults have seen an NHS dentist in the past two years. Across England the figure runs from that low to 55.9% in South Yorkshire. Areas at the bottom of that range are often called dental deserts, a term with no single official definition, which this page returns to below.
Report Highlights
- Somerset Integrated Care Board (ICB) has the lowest adult NHS dental access in England, at 22.7% of adults seen by an NHS dentist in the 24 months to 31 March 2026, down from 26.3% a year earlier.
- South Yorkshire ICB has the highest, at 55.9%. The gap between the two is 33.2 percentage points, wider than the 30.3 points recorded a year earlier.
- Somerset is also lowest for children, at 41.0% seen in the 12 months to 31 March 2026, against 67.1% in South Yorkshire.
- The five lowest areas for adults are Somerset (22.7%), Devon (26.0%), Cambridgeshire and Peterborough (28.0%), Cornwall and the Isles of Scilly (28.8%) and Gloucestershire (30.3%).
- Across England, 18.8 million adults were seen in the 24 months to 31 March 2026, or 40% of the adult population, and 7.17 million children in the 12 months to the same date, or 60%, up from 57% a year earlier.
- Adult access remains well below pre-pandemic levels. 49.4% of adults had seen a dentist in the two years to September 2019, against 39.8% in the two years to June 2025 on the House of Commons Library measure.
- Of survey respondents who tried to get an NHS dental appointment, 78% succeeded. In the South West the figure was 66%, the lowest of any NHS region.
- At ICB level the appointment success rate ran from 56% in Somerset to 89% in Coventry and Warwickshire.
- A quarter of people who had never tried to get an NHS dental appointment said the reason was that they did not think they would be able to.
- The average English or Welsh local authority has 16 NHS dental practices per 100,000 people. The lowest count in England is 10 per 100,000, in Middlesbrough and four other local authorities, while the more affluent Richmond upon Thames has 28 per 100,000.
- A peer-reviewed spatial analysis published in August 2026 found that 2.34 million people in England live in a neighbourhood with no NHS dental provider within 5km.
What is a dental desert?
A dental desert is a shorthand term for an area where NHS dental provision is very thin relative to the population, and it has no single official statistical definition, so different studies measure it in different ways. This page ranks areas on access, meaning the share of the population actually seen by an NHS dentist. Two other published measures use supply instead, counting practices or providers per head or by distance. The three do not produce the same list, and the differences are set out below.
Access, by Integrated Care Board. The measure used in the table on this page. NHS Business Services Authority data on the share of adults and children seen by an NHS dentist in the reference period.
Practice density, by local authority. The Local Government Association measured dental deserts in August 2025 as the number of active dental practices offering NHS services per 100,000 residents. On that measure the mean for an English or Welsh local authority was 16 practices per 100,000 and the median was 15. No local authority in the country had more than one NHS dental practice per 1,000 people.
Distance to a provider, by neighbourhood. In August 2026 the British Dental Journal published a national spatial analysis by Hugh Devlin of the University of Bristol, which defines a dental desert at Lower Layer Super Output Area level as a neighbourhood with no NHS dental provider within 5km. It geocoded 9,791 active NHS practices and identified 1,340 desert neighbourhoods containing 2,342,985 residents, about 4% of England. Within that, 112 neighbourhoods in the three most deprived deciles, containing 189,542 residents or 0.33% of England's population, were classed as high need. Ninety-seven per cent of that high-need population was rural, concentrated in Cornwall, East Lindsey, and King's Lynn and West Norfolk.
The Devlin analysis reaches a conclusion that runs against the more common framing. Because NHS dental provision is concentrated in deprived urban areas, a smaller share of the most deprived population lives more than 5km from a provider than of the less deprived population. Deprivation and distance are therefore two separate measures. This page ranks on access, which captures both effects at once but attributes neither.
What is NHS dental access by ICB in England?
NHS dental access by Integrated Care Board in England ranges from 22.7% of adults seen in Somerset to 55.9% in South Yorkshire, and from 41.0% of children seen in Somerset to 67.1% in South Yorkshire, across all 42 Integrated Care Boards in the table below.
Sorted by the percentage of adults seen, highest to lowest.
| Rank | Integrated Care Board | Adults seen, 24 months to 31 Mar 2026 | Children seen, 12 months to 31 Mar 2026 |
|---|---|---|---|
| 1 | South Yorkshire | 55.9% | 67.1% |
| 2 | Coventry and Warwickshire | 48.8% | 58.5% |
| 3 | Greater Manchester | 48.3% | 64.8% |
| 4 | Black Country | 48.0% | 56.8% |
| 5 | Mid and South Essex | 47.6% | 58.5% |
| 6 | Cheshire and Merseyside | 46.2% | 64.1% |
| 7 | Hertfordshire and West Essex | 45.4% | 63.9% |
| 8 | West Yorkshire | 45.0% | 64.6% |
| 9 | Nottingham and Nottinghamshire | 44.6% | 65.2% |
| 10 | Staffordshire and Stoke-on-Trent | 44.5% | 63.6% |
| 11 | Birmingham and Solihull | 44.1% | 53.3% |
| 12 | South East London | 43.8% | 58.5% |
| 13 | North East and North Cumbria | 43.0% | 60.2% |
| 14 | Shropshire, Telford and Wrekin | 43.0% | 64.3% |
| 15 | Lancashire and South Cumbria | 42.8% | 65.4% |
| 16 | Derby and Derbyshire | 41.8% | 61.1% |
| 17 | Leicester, Leicestershire and Rutland | 41.7% | 64.1% |
| 18 | Humber and North Yorkshire | 40.5% | 64.6% |
| 19 | North West London | 40.0% | 56.6% |
| 20 | Sussex | 39.2% | 61.0% |
| 21 | Suffolk and North East Essex | 38.7% | 59.6% |
| 22 | North Central London | 38.3% | 52.9% |
| 23 | Frimley | 38.2% | 55.7% |
| 24 | Herefordshire and Worcestershire | 37.7% | 57.3% |
| 25 | Bristol, North Somerset and South Gloucestershire | 37.6% | 60.8% |
| 26 | Lincolnshire | 37.6% | 55.5% |
| 27 | Kent and Medway | 37.5% | 57.2% |
| 28 | Buckinghamshire, Oxfordshire and Berkshire West | 36.4% | 57.2% |
| 29 | North East London | 36.2% | 51.5% |
| 30 | South West London | 36.1% | 49.9% |
| 31 | Hampshire and Isle of Wight | 36.0% | 58.1% |
| 32 | Bedfordshire, Luton and Milton Keynes | 35.1% | 57.3% |
| 33 | Norfolk and Waveney | 34.0% | 56.5% |
| 34 | Northamptonshire | 33.1% | 53.3% |
| 35 | Dorset | 32.9% | 54.4% |
| 36 | Surrey Heartlands | 32.5% | 53.9% |
| 37 | Bath and North East Somerset, Swindon and Wiltshire | 31.9% | 56.6% |
| 38 | Gloucestershire | 30.3% | 54.5% |
| 39 | Cornwall and the Isles of Scilly | 28.8% | 55.9% |
| 40 | Cambridgeshire and Peterborough | 28.0% | 53.7% |
| 41 | Devon | 26.0% | 48.5% |
| 42 | Somerset | 22.7% | 41.0% |
Source: NHS Business Services Authority, NHS Dental Statistics for England 2025/26, statistical summary, published 27 August 2026 and corrected 9 September 2026. Figures are taken from the contract location versions of Table 7 (adults) and Table 8 (children).
Period covered: 24 months to 31 March 2026 for adults, 12 months to 31 March 2026 for children.
Geography level: Integrated Care Board, by contract location. All 42 English ICBs are included.
Note on the England row: the source tables carry no England total row, so none is shown here. The England figures quoted elsewhere on this page come from the narrative text of the same publication and are not labelled by contract or patient location.
What geography level is this data, and why not local authority?
This table is at Integrated Care Board level, which is the most granular breakdown published in the NHS Business Services Authority statistical summary, and the ICB figures shown are counted by contract location rather than by where the patient lives.
Finer geography is available elsewhere. The NHS Business Services Authority publishes patients seen data at local authority and ward level in the data files that accompany the statistical summary. The House of Commons Library publishes a constituency-level dashboard covering the share of people who have seen a dentist recently, alongside practice locations and workforce trends.
Contract location means a patient is counted against the area containing the dental practice they attended, not the area they live in. Where people routinely cross a boundary for care, the area containing the practice will look better and the area they travel from will look worse. The NHS Business Services Authority publishes a parallel set of figures based on patient postcode, and reports that 1.3% of courses of treatment came from postcodes that could not be mapped to an area. It also warns that historical figures for contract location at sub-national level can change between releases, and advises always using the latest release.
Methodology: where does each column come from?
Each column is taken from a single named dataset, with no modelling, estimation or interpolation applied by this page.
- Integrated Care Board names. The 42 ICBs as listed in the NHS Business Services Authority statistical summary for 2025/26.
- Adults seen, 24 months to 31 March 2026. NHS Business Services Authority, NHS Dental Statistics for England 2025/26, statistical summary, published 27 August 2026 and corrected 9 September 2026, contract location version of Table 7. The measure counts adult patients whose most recent course of treatment started within the previous 24 months, expressed against Office for National Statistics mid-year population estimates. The 24-month window follows NICE oral health recall guidance.
- Children seen, 12 months to 31 March 2026. Same publication, contract location version of Table 8. The child measure uses a 12-month window, so the adult and child columns are not directly comparable with one another.
- The 9 September 2026 correction. The NHS Business Services Authority published a notice on 9 September 2026 stating that it had identified an error in the patients seen adult percent and child percent columns of Table 3d of the contract location geographical breakdown, that the file had been updated to rename the previous column and add the correct adult percent column, and that the contract location version of Table 7 in the narrative report had also been updated. It also removed duplicate rows from two contract location CSV files, and stated that there was no change to the key findings. The figures on this page are taken from the corrected version. Anyone comparing against a copy of the table downloaded before 9 September 2026 should expect differences.
- England totals. Same publication, narrative text. Rounded to whole percentages in the source and reproduced as such.
- Appointment success rates quoted in the text. NHS England, GP Patient Survey Dental Statistics, January to March 2025, England, published 24 July 2025, fieldwork January to March 2025, 2.72 million questionnaires sent and 702,837 returned, a response rate of 25.8%. This remains the most recent dental edition of the survey.
- Practices per 100,000 population quoted in the text. Local Government Association analysis published 28 August 2025, using NHS England Digital and LG Inform data.
- Neighbourhood distance measure. Devlin H, High-need dental deserts in England: a national spatial analysis of NHS access and deprivation, British Dental Journal, 14 August 2026.
- Pre-pandemic comparison figures, and the full time equivalent NHS dentist count for March 2024. House of Commons Library briefing CBP-9597, NHS dentistry in England. The full time equivalent count is a Commons Library figure with a March 2024 reference date and does not appear in the NHS Business Services Authority publication.
The 33.2 percentage point gap between the highest and lowest ICB is a subtraction of two published figures.
Which ICBs have the lowest adult NHS dental access?
The ICBs with the lowest adult NHS dental access are Somerset, Devon, Cambridgeshire and Peterborough, Cornwall and the Isles of Scilly, and Gloucestershire, where between 22.7% and 30.3% of adults were seen by an NHS dentist in the 24 months to 31 March 2026.
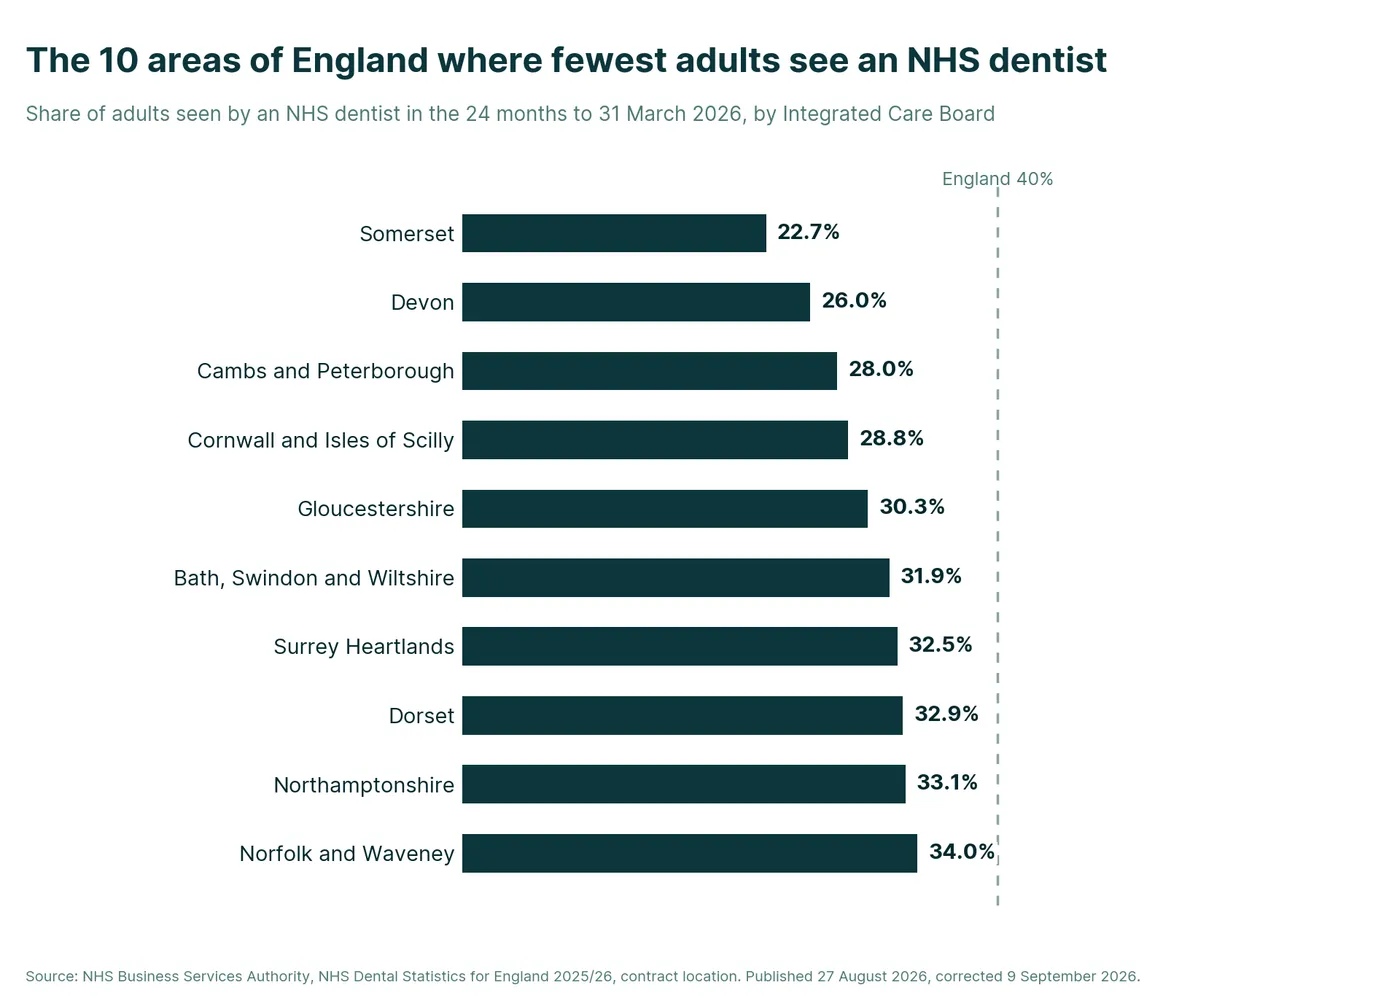
Four of those five are in the South West. Cambridgeshire and Peterborough is the exception, sitting third from bottom for adults at 28.0% despite being in the East of England, and it has been near the bottom of the table for two consecutive years.
The order within that group changed between releases. Devon recorded the largest single-year fall of any ICB in the table, down 4.0 percentage points from 30.0% to 26.0%, which moved it from fourth lowest to second lowest. Somerset had the second largest fall, down 3.6 points from 26.3% to 22.7%. Cornwall and the Isles of Scilly was third, down 1.9 points. Three of the four largest falls in England were in the South West.
Which areas of England have the best NHS dental access?
The areas of England with the best NHS dental access are South Yorkshire at 55.9%, Coventry and Warwickshire at 48.8% and Greater Manchester at 48.3% of adults seen in the 24 months to 31 March 2026.
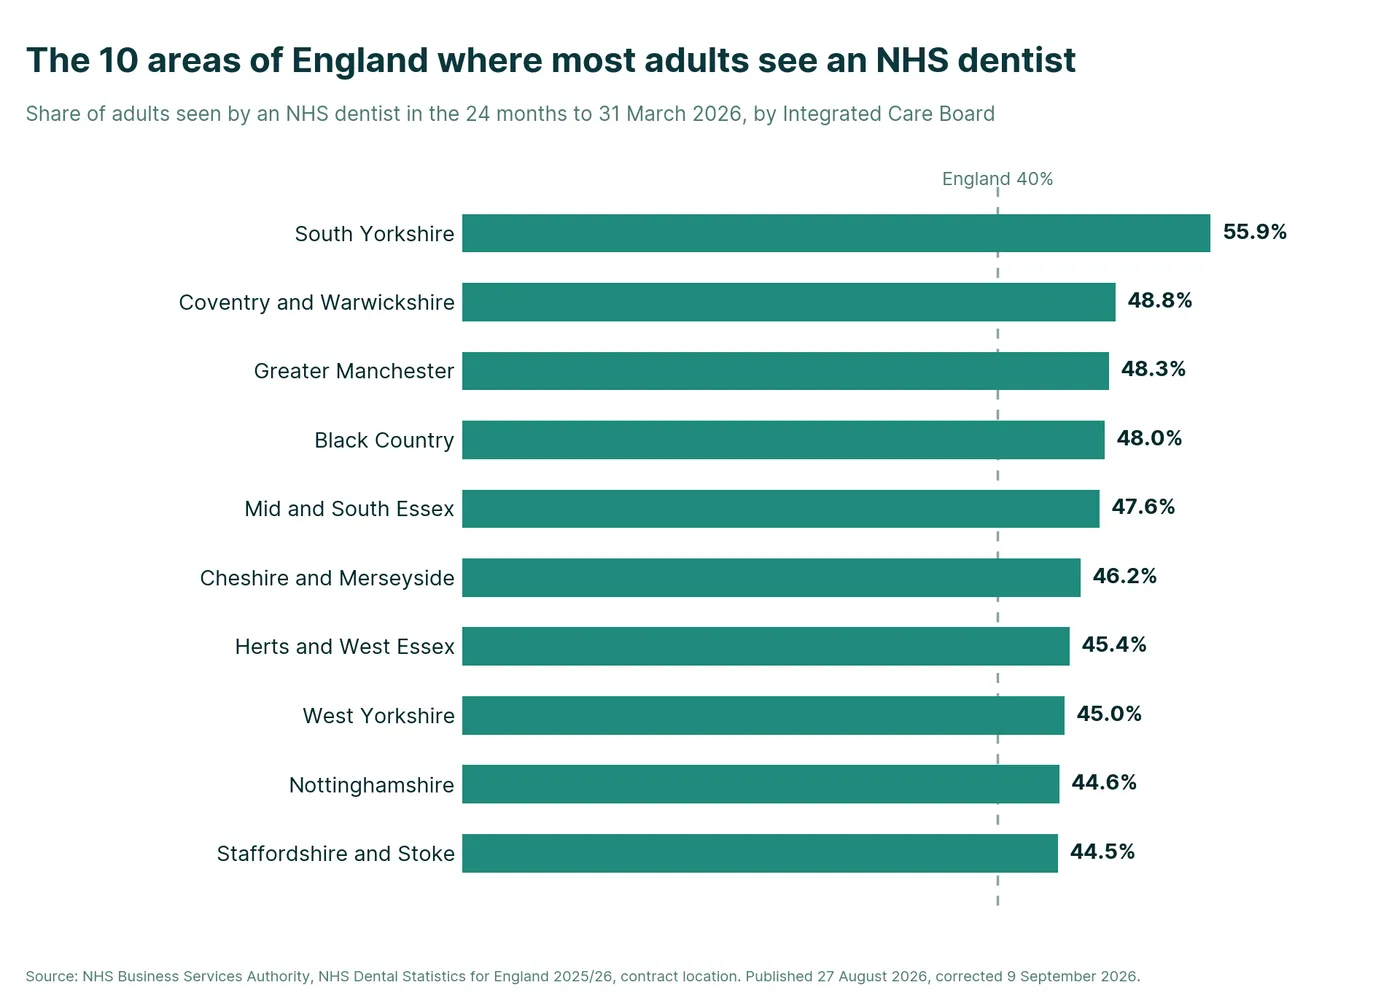
South Yorkshire leads on both measures, and is the only ICB in England where more than half of adults and more than two thirds of children were seen in the reference period. It is now the only ICB above 50% for adults. A year earlier there were two, with Coventry and Warwickshire at 50.1%.
Which local authorities have the fewest NHS dental practices?
Barking and Dagenham, Middlesbrough, Newham, Thurrock and West Northamptonshire had the fewest NHS dental practices of any English local authority, at 10 per 100,000 people. The Local Government Association scopes that ranking to England only.
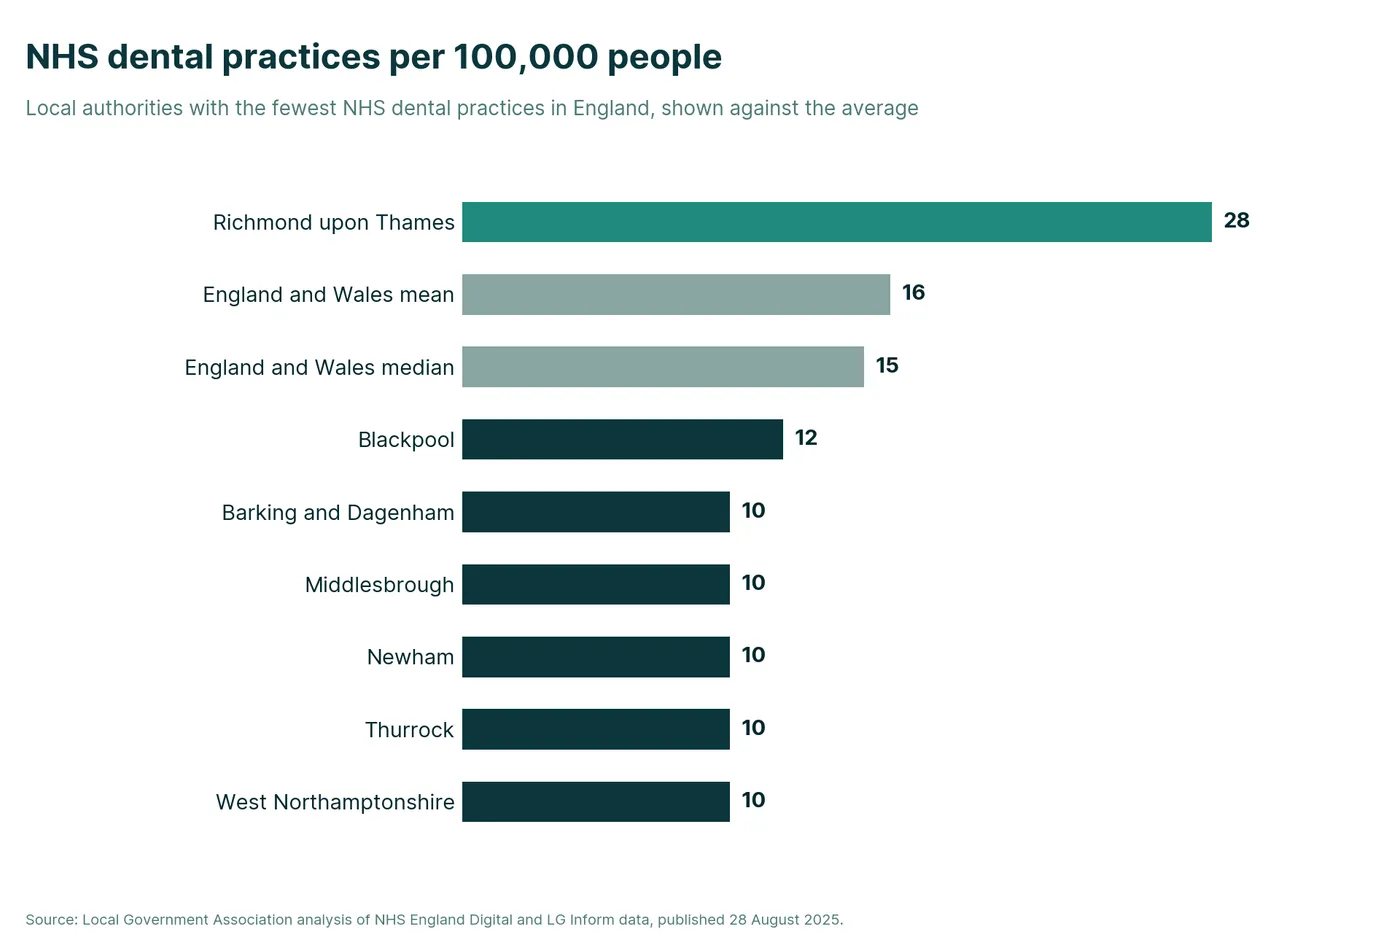
The Local Government Association sets Middlesbrough against Richmond upon Thames, which has 28 practices per 100,000 people, as a contrast between a more deprived area and a more affluent one rather than as the two ends of a national range. Blackpool, the most deprived local authority in England, had 12 per 100,000. The Local Government Association reported that rural areas were more likely to have fewer NHS practices.
How many adults in England have seen an NHS dentist?
18.8 million adults in England were seen by an NHS dentist in the 24 months to 31 March 2026, which is 40% of the adult population.
On the rolling measure used in the House of Commons Library briefing, 39.8% of adults had seen an NHS dentist in the two years to June 2025. The two figures are close but are not the same measure and are not drawn to the same date.
How many children in England have seen an NHS dentist?
7.17 million children in England were seen by an NHS dentist in the 12 months to 31 March 2026, which is 60% of the child population, up from 57% the previous year.
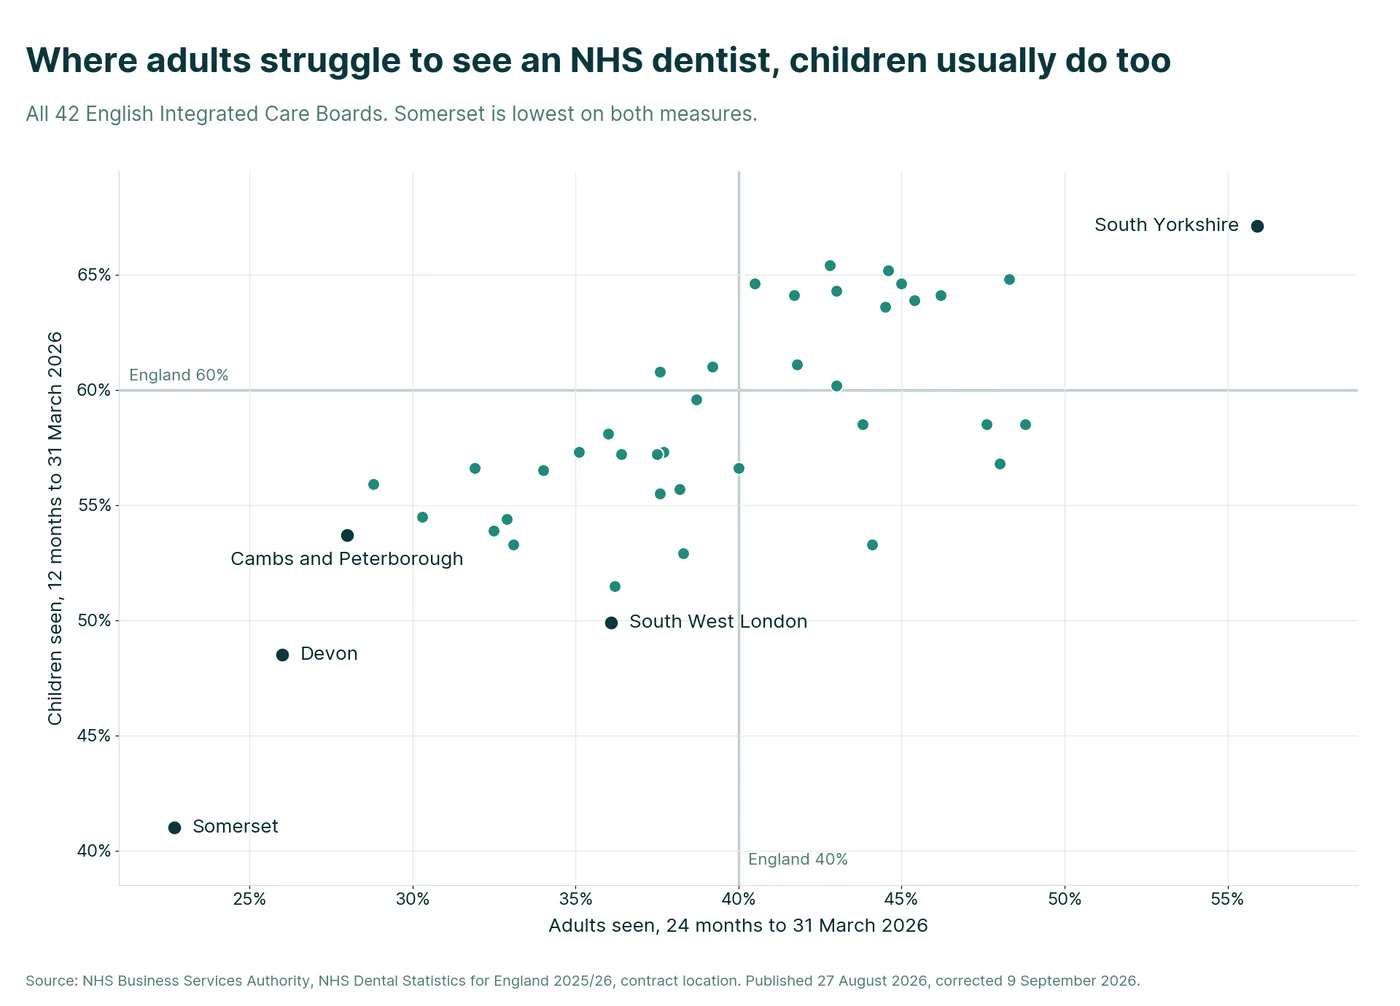
The House of Commons Library reports a separate figure of 57.3% of children seen in the two years to June 2025. The two numbers are close but measure different things, one a 12-month window and one a 24-month window.
Where is it hardest to get an NHS dental appointment?
It is hardest to get an NHS dental appointment in Somerset, where 56% of survey respondents who tried to get one succeeded, against 89% in Coventry and Warwickshire and 78% across England as a whole.
At regional level the South West had the lowest success rate at 66%, the weakest of any NHS region. Just over half of respondents, 51.2%, had tried to get an NHS dental appointment for themselves in the previous two years at all. Of those who had never tried, about a quarter said the reason was that they did not think they would be able to get one.
Has NHS dental access in England got better or worse since 2019?
NHS dental access for adults in England is worse than before the pandemic, with 49.4% of adults seen in the two years to September 2019 against 39.8% in the two years to June 2025, a fall of 9.6 percentage points.
Activity has continued to recover from its lowest point. There were 37.6 million courses of treatment delivered in 2025/26, 6% more than in 2024/25, and 76.8 million units of dental activity, 5% higher. The number of dentists with any NHS activity was 25,419 in 2025/26, up 3%, or 43 dentists per 100,000 people, according to the NHS Business Services Authority. A separate measure, published by the House of Commons Library and counted at a different reference date, puts the number of full time equivalent NHS dentists in England at around 10,500 as at March 2024. The two are not subsets of one another and should not be compared directly.
Activity is rising while the adult access rate holds at 40%. More treatment is being delivered, but not to a larger share of the adult population.
Does this data cover Scotland, Wales and Northern Ireland?
No. Every figure in the table covers England only, because the NHS Business Services Authority dental statistics are an England publication, and the other three UK nations publish their own statistics on different definitions that cannot be placed in the same ranking.
The nearest equivalents, each measured differently, are as follows. In Scotland, 5,273,339 people were registered with an NHS dentist at 31 March 2026, an estimated 95.1% of the population, and 3,273,405 of them, 62.1%, had participated in NHS primary dental care within the previous two years. The registered count rose while the percentage fell, which reflects population growth rather than a fall in registration. In Wales, 40.1% of the adult population received NHS dental treatment in the 24 months ending 30 June 2025, and 48.2% of children received treatment in the 12 months ending 30 June 2025. In Northern Ireland, 49% of the population was registered with a Health Service dentist at the end of March 2026, made up of 44% of adults and 67% of children, with the adult rate down 6 percentage points on the previous year.
Registration in Scotland and Northern Ireland is not the same measure as being seen or treated, so a high registration rate does not mean a high rate of care delivered.
Where does the NHS publish this data and in what format?
The NHS Business Services Authority publishes the England dental statistics as a collection of zipped CSV bundles and Excel workbooks alongside two HTML documents, one a statistical summary and one a background and methodology guide.
The 2025/26 release covers contract location, patient location, ICB, local authority, ward and sub-ICB level, and added an analysis of patient deprivation by Index of Multiple Deprivation decile. NHS England publishes the GP Patient Survey dental results separately, as a PDF report and an Excel workbook, in July each year.
How often is this page updated?
This page is updated when the NHS Business Services Authority publishes its annual dental statistics for England, and again whenever it issues a correction notice.
The 2025/26 release was published on 27 August 2026 and corrected on 9 September 2026. This page reflects the corrected figures. On the pattern of the last two releases, the 2026/27 statistics are expected in late August 2027.
What can you do if you cannot get an NHS dentist?
If you are struggling to find an NHS dentist near you, the NHS Find a dentist service lists practices in England, and NHS 111 can direct you to urgent dental care if you are in pain or have swelling.
Some people facing a long wait choose to have planned treatment privately, either in the UK or abroad. At Myra Dental Centre in Antalya, we welcome patients from across the UK for treatments such as implants, crowns and veneers. You can read how dental treatment in Turkey works, compare our treatment prices, or get in touch for a free consultation.
Whichever route you take, regular check-ups close to home remain the best way to keep your teeth and gums healthy.
Sources
- NHS Business Services Authority, NHS Dental Statistics for England 2025/26, statistical summary. Published 27 August 2026, corrected 9 September 2026. https://nhsbsa-opendata.s3.eu-west-2.amazonaws.com/dental/dental_narrative_2025_26_v001.html
- NHS Business Services Authority, Dental statistics - England 2024/25 (previous release, used only for year-on-year comparisons). Published 28 August 2025, updated 27 March 2026. https://www.nhsbsa.nhs.uk/statistical-collections/dental-england/dental-statistics-england-202425
- House of Commons Library, NHS dentistry in England, briefing CBP-9597. Published 10 June 2026. https://commonslibrary.parliament.uk/research-briefings/cbp-9597/
- NHS England, GP Patient Survey Dental Statistics, January to March 2025, England. Published 24 July 2025. https://www.england.nhs.uk/statistics/statistical-work-areas/patient-surveys/gp-patient-survey/gpps-dental-statistics/gp-patient-survey-dental-statistics-january-to-march-2025-england/
- NHS England, GP Patient Survey, Supplementary Dental Analysis, January to March 2025 (PDF). Published 24 July 2025. https://www.england.nhs.uk/statistics/wp-content/uploads/sites/2/2025/07/GP-Patient-Survey-Supplementary-Dental-Analysis-January-to-March-2025.pdf
- Local Government Association, Persistent 'dental deserts' risk deprived and rural communities being left behind. Published 28 August 2025. https://www.local.gov.uk/about/news/persistent-dental-deserts-risk-deprived-and-rural-communities-being-left-behind
- Devlin H, High-need dental deserts in England: a national spatial analysis of NHS access and deprivation. British Dental Journal, 14 August 2026. https://www.nature.com/articles/s41415-026-9877-2
- NHS Business Services Authority, Dental statistics - England 2025/26 (collection page, data files and notice of correction). Published 27 August 2026, updated 9 September 2026. https://www.nhsbsa.nhs.uk/statistical-collections/dental-england/dental-statistics-england-202526
- House of Commons Library, Constituency data: Dentists and dental practices, briefing CBP-10897. Published 7 September 2026, last updated 9 September 2026. https://commonslibrary.parliament.uk/research-briefings/cbp-10897/
- Public Health Scotland, NHS dental data monitoring report, quarter ending March 2026. Published 26 May 2026. https://publichealthscotland.scot/publications/nhs-dental-data-monitoring-report/
- Senedd Research, Developments in NHS dentistry in Wales. Published 27 November 2025. https://research.senedd.wales/research-articles/developments-in-nhs-dentistry-in-wales/
- Department of Health (Northern Ireland), Publication of Family Practitioner Services General Dental Statistics for Northern Ireland 2025/26. Published 18 June 2026. https://www.health-ni.gov.uk/news/publication-family-practitioner-services-general-dental-statistics-northern-ireland-202526

Dt. Erdem Çetin
Born in Stuttgart, Germany in 1979, Dr. Dt. Erdem Çetin began his education in Kırşehir and completed his schooling there, from primary school through to high school. He then successfully completed his university education at the Faculty of Dentistry at 19 Mayıs University in Samsun.
Share your phone number with us, we'll call you!